In order to make the race a better experience for you, the start groups are seeded. What this means is that your past results determine who you start with in your start group to ensure optimal competetiveness and flow. It also let us predict times during the race so that family and fans can watch you compete. We have been seeding all national races in Sweden for years, and also major championships such as OCRWC2024
To check if you already have an Athlete ID, or to register an Athlete ID, click here.
We rely on the race organizer to submit their races to us. We have asked each national OCR association to submit races as well. If you feel any race is missing, please contact the race organizer and ask them to send the results file to us at ranking@ocrrunner.com. Please also ensure that the race followed FISO-rules.
Each race listed on the "Upcoming races"-page will award ranking points. If you have ran a race, ensure that the results have been published by visiting the Races List. If you are missing from the race result list, contact the organiser as it is them that must send us the correct result list.
Please look at the common questions section below, and also the section about ranking score calculation.
An athlete and their results from a race will be on the ranking list if:
To check if you already have an Athlete ID, or to register an Athlete ID, click here.
Each race listed on the "Upcoming races"-page will award ranking points.
Only athletes with published results are visible on the ranking list. If you have registered but not yet ran a race, you can find your Athlete ID here. Use the same link if you want to register.
Each race listed on the "Upcoming races"-page will award ranking points. If you have ran a race, ensure that the results have been published by visiting the Races List. If you are missing from the race result list, contact the organiser as it is them that must send us the correct result list.
The results and rankings are based on the lists provided to us by the race organiser. If something is wrong with the data you have to contact the organiser and ask them to correct it and send us a new list. If the organiser is not cooperating, you may contact us at ranking@ocrrunner.com and we will investigate the issue.
While it might initially appear that some races offer better scoring opportunities, the underlying mechanics of our ranking system ensure a level playing field. In any given race, a set percentage of the participants are likely to achieve a score that improves upon their previous results. The low scores of some athletes observed at some events can be attributed to exceptional individual performances and the presence of highly ranked competitors, rather than any systemic bias towards specific events.
This is a common misconseption. The women's scores are not noticeably affected by the men's performances. Each participants performance is gauged against the overall performance of all participants. The scores of the women would not have been different if we would have split the calculations of men and women, something we have put much time into analyzing. The difference would be around +-2% in score. A great benefit of this system is also that it is possible to know the performance level of an athlete irregardless of the gender, and to find people who are in the same level. A woman with the score of 30 would perform similar to a man with the score of 30. This also helps for seeding races where the genders are not divided into separate groups.
The score calculation is completely autonomous and uses all times in the race to calculate individual scorings. It indirectly takes into account the difficulty of the race, where objectively harder races generally give a better score than objectively easier races. Note that there is no assessment of the race's difficulty level; this is a result of how the algorithm is constructed. This creates a fair system as it removes human opinion. An Athletes ranking score is the average of their best three ranking points in the past 14 months
The calculation algorithm has been developed based on the experiences we have gathered over the years. We have conducted in-depth analyses and test runs of various calculation models and worked our way to a point calculation as fair and accurate as possible. We now have 14851 results from 131 competitions ran by 5814 athetes that we have used as a basis for the analyses. Each ranking point roughly corresponds to a 1 minutes delay relative to an ideal athlete in a 60 minute race. For example, a ranking score of 18 indicates that a participant is expected to finish 18 minutes behind the ideal athlete, assuming a winning time of 60 minutes.
If the race is a world championship, the scores will be calculated in the same way but scaled so that the winner of each gender gets 0 points. Similarly the winner of each gender will get 0.1 points if it is a continental championship. World Series races are scaled either so that the winner get 0.5, or a 2 point reduction, whichever is the least reduction.
To calculate the ranking points for a race, the participant's time and previous ranking score are used to derive a performance number for that participant. This is done for all participants. An average of all performance numbers gives the race's average performance. If the participant has performed better than this average performance, the awarded ranking points will be better than the person's current ranking score. Otherwise, it will be worse. A participant that did not complete the race gets 300 points.
First, an individual performance factor (iPF) is calculated by comparing the participant's time (T) with their previous ranking score (S). This is only done for participants who previously have ranking points and who completed the race. The calculation is made using the formula iPF = (60 + S) / T.
The individual performance factors (iPF) are then sorted in descending order. The race's performance factor (PF) is determined by the value at the 40th percentile of the sorted iPF list. For instance, in a race with eleven completers, the fifth iPF value is selected.
DNFs are used as a means to estimate the difficulty of the race. Two multipliers are calculated, a Count multiplier that adjusts for the DNF count and a Ranking multiplier that looks at the ranking of the DNFs. If the ranking of the DNFs is lower, the ranking of the finishers will be better.
The Count multiplier (cM) uses the fraction of DNFs (fDNF) among the participants. The formula is cM = 1 - fDNF/7.
The Ranking multiplier (rM) also uses the median ranking of the DNFs (mDNF). The formula is rM = (1 - fDNF) + min(fDNF * min(1 - (100 - mDNF) / 700, 1)).
Subsequently, each participant’s ranking points (P) in a particular race are calculated using the formula P = (T * PF – 60) * cM * rM. A DNF results in 300 ranking points for that participant.
The parameters of cM and rM have been selected to give a reasonable adjustment compared to the DNF rate and level.
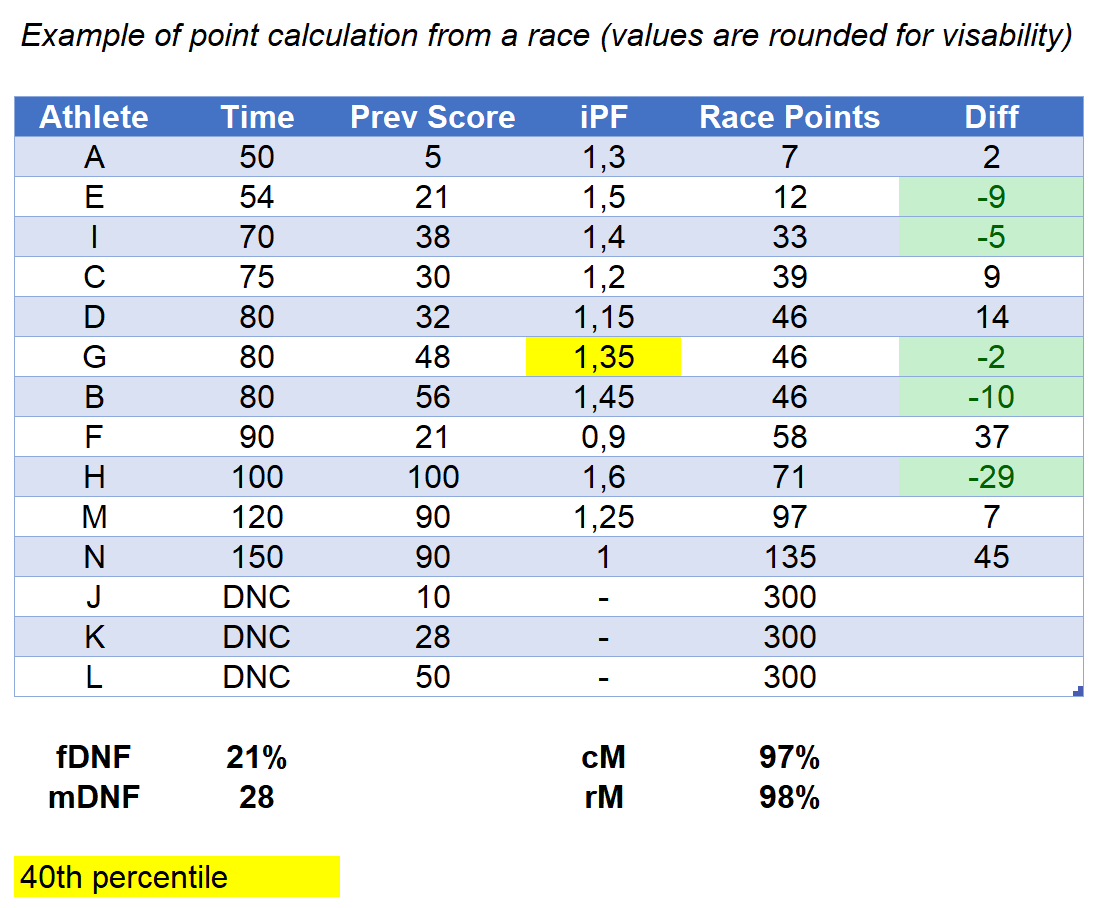
In the example below there is a race with fourteen athletes, sorted by the time they completed the race. The iPF is calculated for the completing athletes according to the equation above. For example, for participant A, iPF = (5+60)/50 = 1.3. As eleven athletes completed the race, the 40th percentile becomes the 5th highest iPF, 1.35, marked in yellow. With a DNF rate of 21% and a median DNF rank of 28, the cM and rM are calculated to approximately 97% and 98% respectively. The points for each participant are then P = (1.35 * T - 60) * 0.97 * 0.98. For A, it becomes (1.35 * 50 - 60) * 0.97 * 0.98 ≈ 7.
Note that all individuals with an iPF higher than the 40th percentile of 1.35 have improved their score relative to their previous score. They have thus performed better relative to their ranking. Similarly, all with an iPF lower than 1.35 have worsened their score compared to their previous score. This results in participant A, even though they win the race, receiving a score that is 2 points worse than A's previous ranking points. This is because participant A was expected to run even faster relative to the competition. Of course, participant A still gets the lowest score in the race.
Total Registered Athletes: 5814
Women Athletes: 1429
Male Athletes: 4061
Total Registered Races: 131
Total Registered Results: 14851
For those interested into the performance of the ranking lists, this section aim to give a deeper understanding about the accuracy of the data
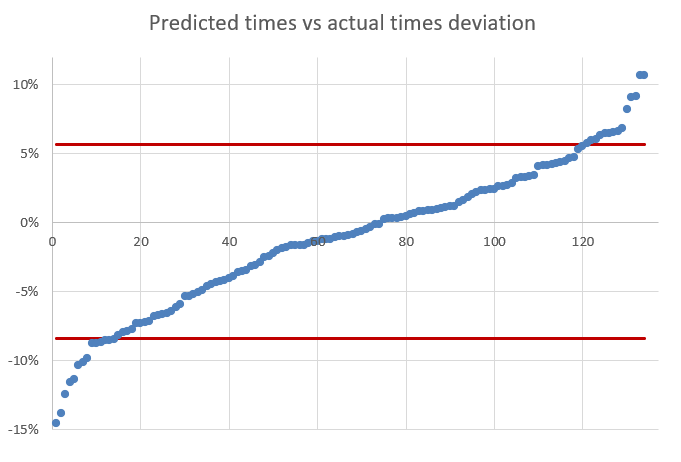
For the Swedish National Championship we were contacted to help seed the race to minimize queues and ensure quality starting groups. They also wanted us to predict times for the runners. Afterwards we did a benchmark to see how well our predictions worked.
The result can be seen in the image below. We predicted the finishing times for 137 contestants in a 12km obstacle course race. We managed to get a correct time +-7% for 80% of the contestants, and a majority of the contestants times were predicted within +-3.5%
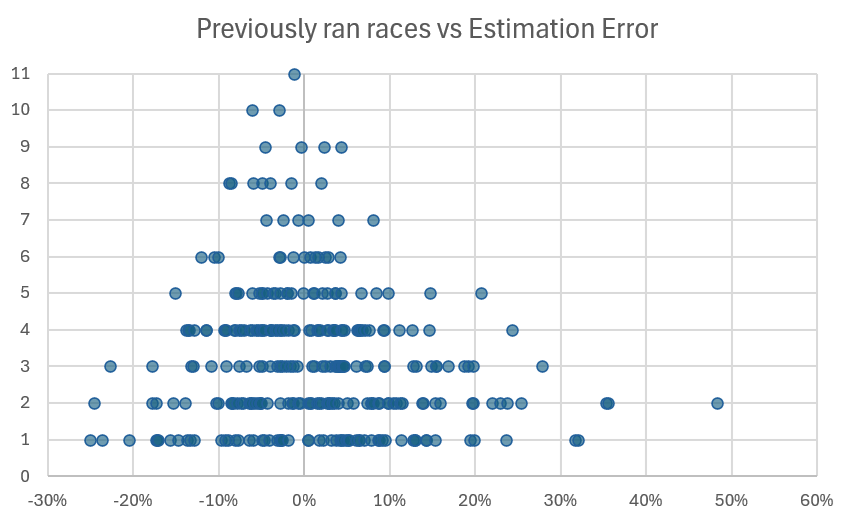
When analyzing the results from the international championships, we gained the insight that a lot of the uncertanty came from participants who had only one or two races registered, as international participants were added 2023. The image below shows the estimation error in percentage together with amount of ran races. The standard deviation of errors were 13% where people had ran 1-2 races, while it was only 7% where people had registered 5-6 races. This shows that the reliability gets even better over time.
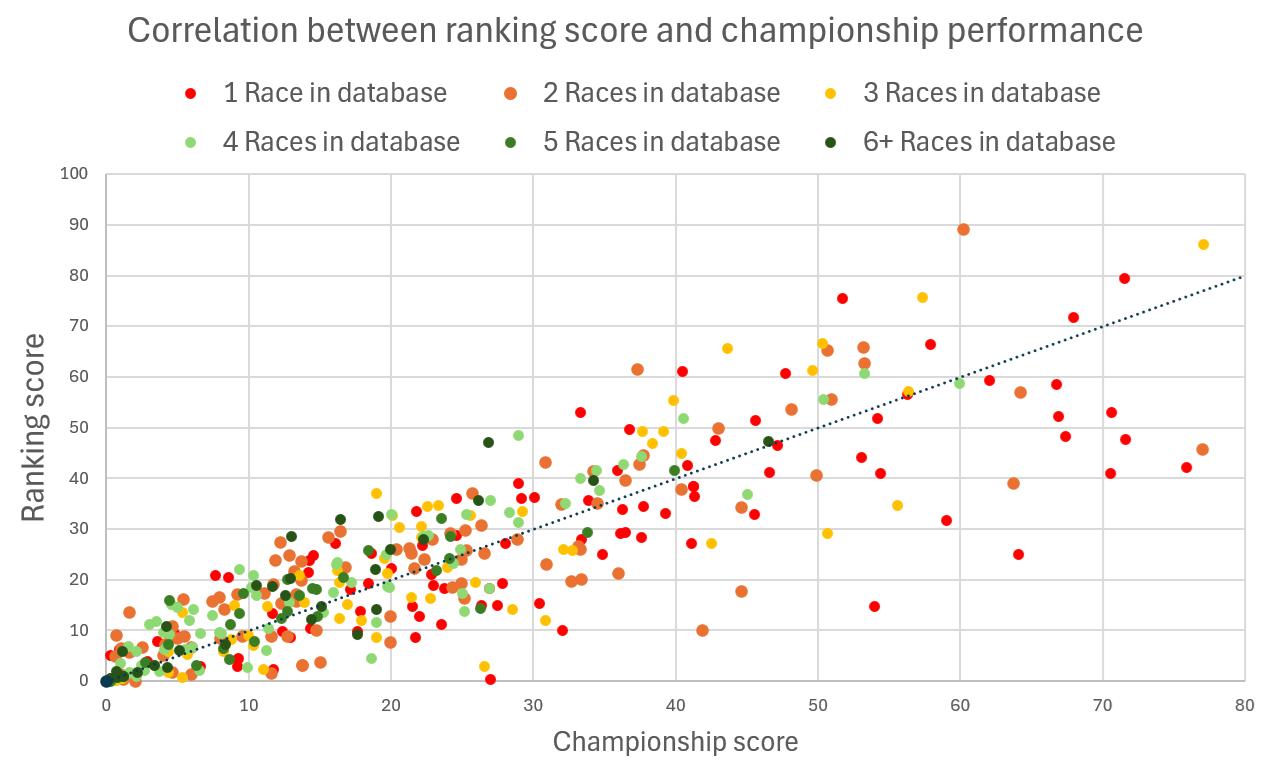
Many nations use our data to select athletes for qualification to the championships. This takes away the hassle of compiling lists, and calculating who has qualified through which race. For this to be a fair method, we must show a linear relationship between championship performance and ranking score. The diagram below shows this, by plotting the athletes ranking score prior to the race on the y-axis, and the resulting score on the x-axis. The dots have been colored depending on how many previous races we have in the database of that athlete. What we can see is indeed a very tight relationship, especially for the athlets who has more than three races registered in the database (green dots). This shows that using the ranking score is a fair and accurate predictor for championship performance.